
Continued Learning & Takeaways
You now have a repeatable way to build and improve a LogicModule:
- Start with the data the API or device provides.
- Keep instance identity, datapoint names, and output names aligned.
- Use Active Discovery to decide which instances should be monitored.
- Add alerts and graphs after the collection logic is working.
- Test the finished module on a real resource before sharing it.
Keep exploring module examples
The LogicMonitor monitoring-recipes repository contains community-ready examples and authoring guidance.
- Module authoring skills — reusable guidance for planning, writing, validating, and reviewing modules.
- LogicModule recipes — completed examples to study and adapt.
- Reference documentation — supporting concepts and implementation notes.
Tools for building and debugging
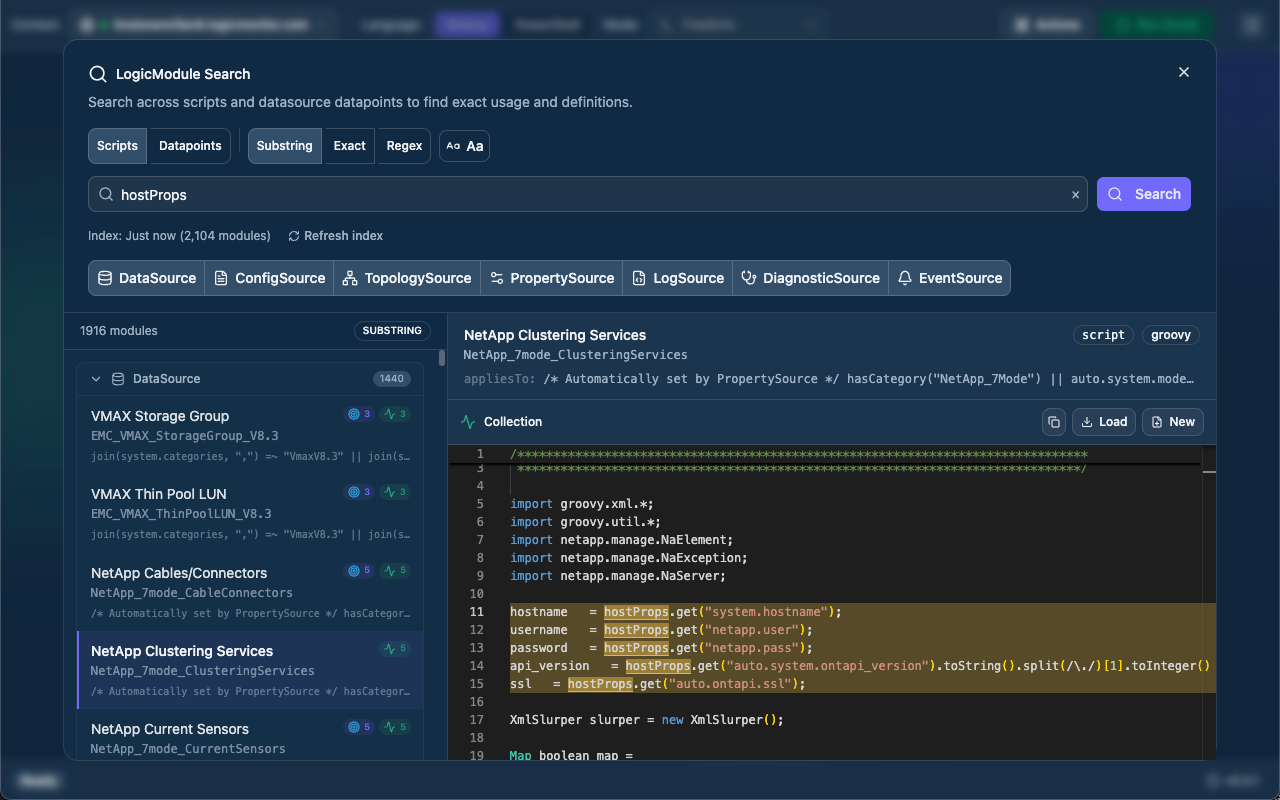
LMDA Composer IDE for Chrome
Install LMDA Composer from the Chrome Web Store
A browser-based workspace for LogicMonitor script development, LogicModule management, API exploration, and multi-Collector execution.
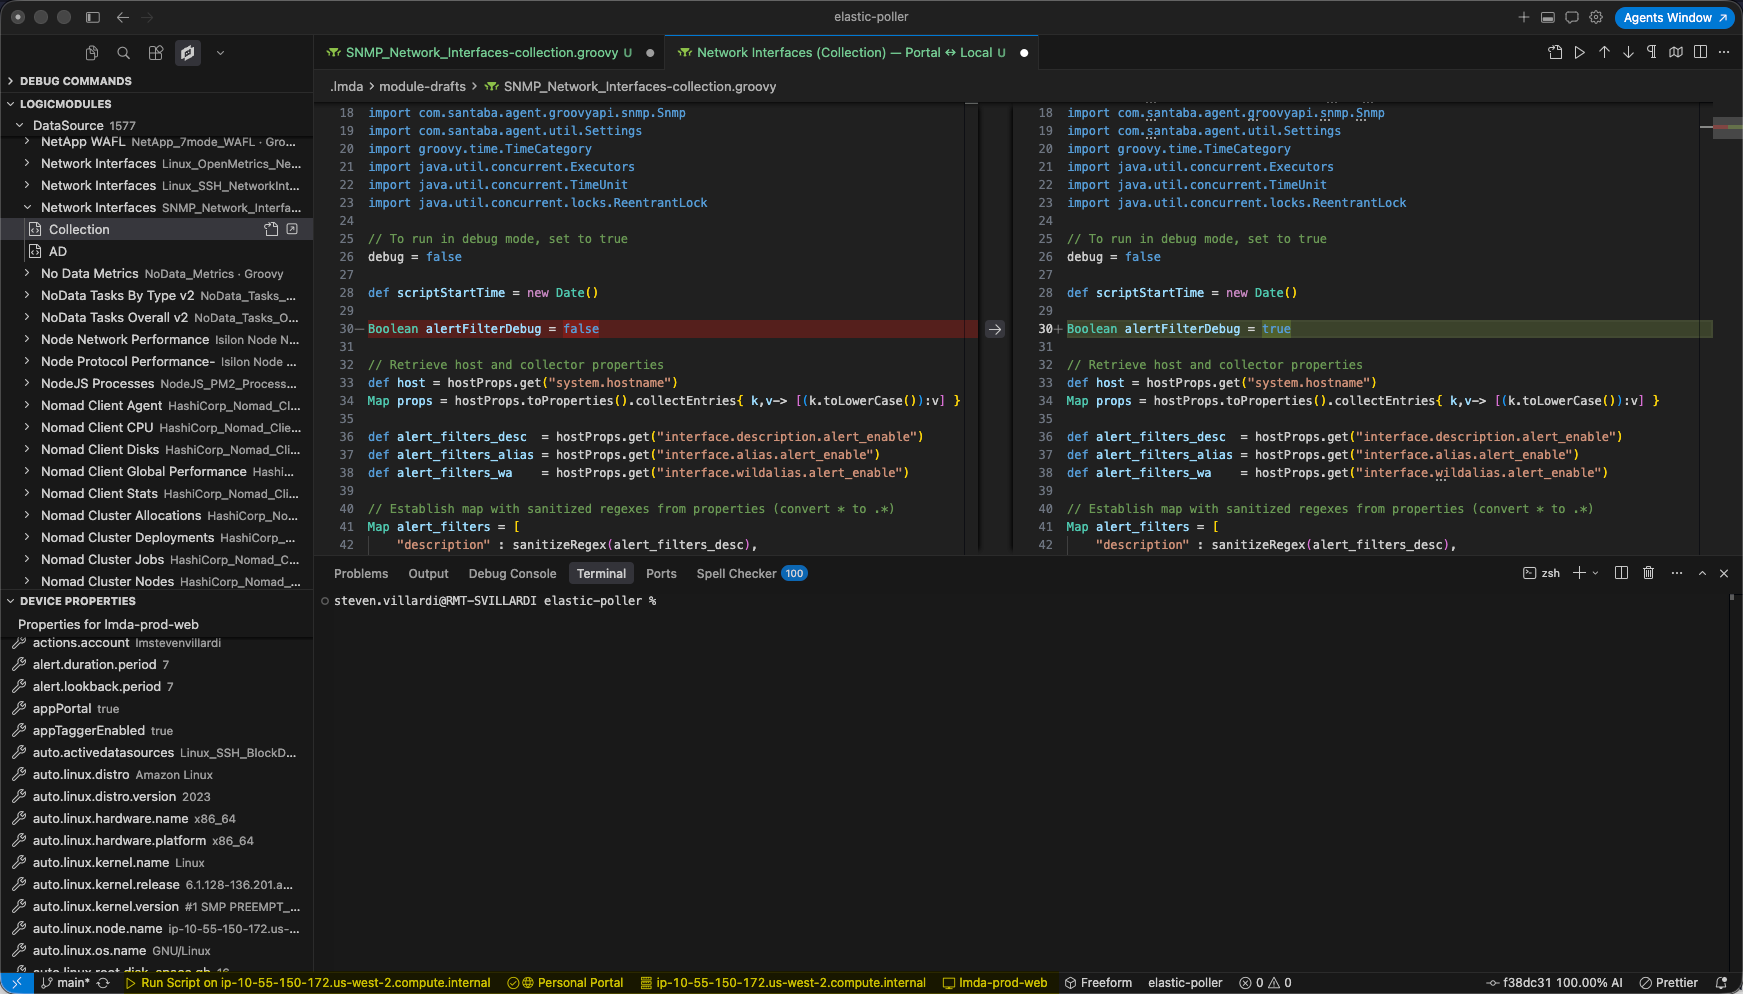
LMDA Composer IDE for VS Code and Cursor
Install LMDA Composer for VS Code
Develop, run, and debug LogicMonitor Groovy and PowerShell module scripts from VS Code or Cursor.
A good next step
Pick one module in the recipes repository and compare it with the modules from this workshop. Look for the same building blocks: resource properties, API requests, discovery output, datapoint mapping, alert behavior, graphs, and validation.